
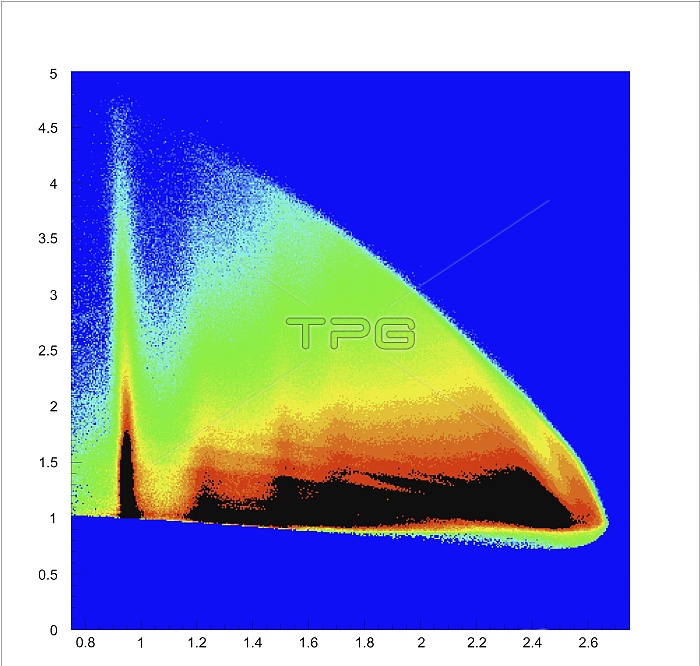
Particle resonances of the proton. The computer display shows the scattering of electrons by protons, which produces a series of resonances of the proton, in the CLAS experiment at Jefferson Lab, Virginia. The proton & its resonances are visible in the graph as black & coloured peaks or hills. The vertical axis is equivalent to scatter- ing angle, the horizontal axis shows energy in GeV. Colour represents the number of events, from black (most events) to blue. The sharp peak at left is the proton itself; the peak at 1.2 GeV is a resonance called the delta; towards the right many resonances are smeared together.
| px | px | dpi | = | cm | x | cm | = | MB |
Details
Creative#:
TOP10162674
Source:
達志影像
Authorization Type:
RM
Release Information:
須由TPG 完整授權
Model Release:
N/A
Property Release:
N/A
Right to Privacy:
No
Same folder images:
 Loading