
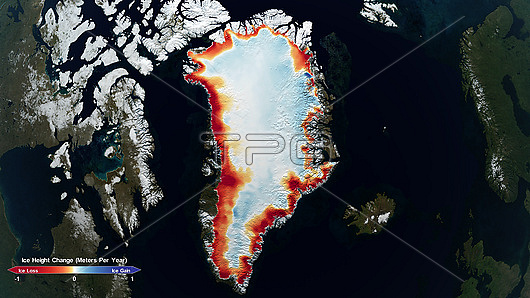
Map showing changes in land ice thickness in Greenland using measurements taken by NASA's IceSat (2003-2009) and IceSat-2 satellites (from 2018). Red coloured areas of the map depict a loss of ice whilst blue areas depict a gain in ice thickness. Scientists are measuring ice loss from the Greenland Ice Sheet because it is one of the largest contributors to sea level rise.
| px | px | dpi | = | cm | x | cm | = | MB |
Details
Creative#:
TOP26811857
Source:
達志影像
Authorization Type:
RM
Release Information:
須由TPG 完整授權
Model Release:
N/A
Property Release:
N/A
Right to Privacy:
No
Same folder images:
 Loading